

 Which country really wins the Olympics?
 Gold medals per population and GDP since 1996
| Rank | Country name | Country | Golds | Golds per person | Golds per GDP |
|---|---|---|---|---|---|
| USA |  USA USA | 284 | 0.86 | 13.649 | |
| China |  CHN CHN | 226 | 0.157 | 15.208 | |
| Russia |  RUS RUS | 169 | 1.158 | 115.431 | |
| Great Britain |  GBR GBR | 118 | 1.738 | 44.726 | |
| Germany |  DEU DEU | 100 | 1.194 | 26.451 | |
| Australia |  AUS AUS | 89 | 3.49 | 66.682 | |
| France |  FRA FRA | 77 | 1.18 | 30.179 | |
| Italy |  ITA ITA | 70 | 1.158 | 37.874 | |
| South Korea |  KOR KOR | 65 | 1.268 | 40.963 | |
| Japan |  JPN JPN | 79 | 0.625 | 16.088 | |
| Cuba |  CUB CUB | 49 | 4.326 | 536.398 | |
| Hungary |  HUN HUN | 48 | 4.969 | 320.13 | |
| Netherlands |  NLD NLD | 51 | 2.976 | 57.540 | |
| Ukraine |  UKR UKR | 35 | 0.8 | 246.046 | |
| Romania |  ROU ROU | 31 | 1.611 | 124.686 | |
| Spain |  ESP ESP | 30 | 0.642 | 24.049 | |
| Poland |  POL POL | 29 | 0.766 | 49.923 | |
| Brazil |  BRA BRA | 28 | 0.132 | 20.531 | |
| New Zealand |  NZL NZL | 27 | 5.599 | 139.502 | |
| Canada |  CAN CAN | 25 | 0.662 | 15.622 | |
| Jamaica |  JAM JAM | 22 | 7.430 | 1,546.247 | |
| Kenya |  KEN KEN | 22 | 0.409 | 217.718 | |
| Greece |  GRC GRC | 19 | 1.823 | 97.749 | |
| Iran |  IRN IRN | 20 | 0.238 | 32.751 | |
| Ethiopia |  ETH ETH | 17 | 0.148 | 177.847 | |
| Norway |  NOR NOR | 20 | 3.689 | 54.587 | |
| Czech Republic |  CZE CZE | 19 | 1.774 | 78.521 | |
| Kazakhstan |  KAZ KAZ | 15 | 0.799 | 90.509 | |
| Denmark |  DNK DNK | 17 | 2.935 | 50.055 | |
| Sweden |  SWE SWE | 16 | 1.584 | 30.243 | |
| Switzerland |  CHE CHE | 16 | 1.849 | 22.603 | |
| Turkey |  TUR TUR | 15 | 0.178 | 23.097 | |
| Belarus |  BLR BLR | 13 | 1.376 | 225.272 | |
| Bulgaria |  BGR BGR | 14 | 2.015 | 206.134 | |
| Croatia |  HRV HRV | 14 | 3.41 | 246.618 | |
| North Korea |  PRK PRK | 10 | 0.388 | 555.556 | |
| South Africa |  ZAF ZAF | 11 | 0.185 | 38.926 | |
| Slovakia |  SVK SVK | 10 | 1.832 | 98.143 | |
| Thailand |  THA THA | 10 | 0.143 | 19.639 | |
| Argentina |  ARG ARG | 8 | 0.177 | 20.901 | |
| Georgia |  GEO GEO | 10 | 2.507 | 612.895 | |
| Azerbaijan |  AZE AZE | 7 | 0.69 | 168.003 | |
| Belgium |  BEL BEL | 10 | 0.863 | 19.864 | |
| Uzbekistan |  UZB UZB | 10 | 0.299 | 167.305 | |
| Bahamas |  BHS BHS | 7 | 17.801 | 605.536 | |
| Colombia |  COL COL | 5 | 0.098 | 18.873 | |
| Indonesia |  IDN IDN | 6 | 0.022 | 5.511 | |
| Lithuania |  LTU LTU | 5 | 1.837 | 90.803 | |
| Slovenia |  SVN SVN | 8 | 3.848 | 154.434 | |
| Taiwan |  TWN TWN | 7 | 0.294 | 11.014 | |
| Algeria |  DZA DZA | 4 | 0.091 | 27.151 | |
| Austria |  AUT AUT | 5 | 0.555 | 11.550 | |
| Finland |  FIN FIN | 4 | 0.722 | 14.933 | |
| Ireland |  IRL IRL | 6 | 1.215 | 15.035 | |
| Mexico |  MEX MEX | 4 | 0.031 | 3.845 | |
| Cameroon |  CMR CMR | 3 | 0.113 | 76.852 | |
| Dominican Republic |  DMA DMA | 3 | 0.277 | 38.519 | |
| Latvia |  LVA LVA | 4 | 2.121 | 121.157 | |
| Nigeria |  NGA NGA | 3 | 0.015 | 6.772 | |
| Serbia |  SRB SRB | 6 | 0.687 | 115.387 | |
| Tunisia |  TUN TUN | 4 | 0.338 | 101.973 | |
| Armenia |  ARM ARM | 2 | 0.675 | 156.091 | |
| Bahrain |  BHR BHR | 2 | 1.175 | 57.763 | |
| Chile |  CHL CHL | 2 | 0.105 | 8.149 | |
| Estonia |  EST EST | 3 | 2.262 | 98.464 | |
| Mongolia |  MNG MNG | 2 | 0.61 | 149.421 | |
| Morocco |  MAR MAR | 3 | 0.081 | 26.733 | |
| Portugal |  PRT PRT | 2 | 0.196 | 9.021 | |
| Trinidad and Tobago |  TTO TTO | 2 | 1.429 | 88.036 | |
| Zimbabwe |  ZWE ZWE | 2 | 0.135 | 142.837 | |
| Burundi |  BDI BDI | 1 | 0.084 | 319.387 | |
| Costa Rica |  CRI CRI | 1 | 0.196 | 16.766 | |
| Ecuador |  ECU ECU | 3 | 0.170 | 32.231 | |
| Egypt |  EGY EGY | 2 | 0.02 | 5.527 | |
| Fiji |  FJI FJI | 2 | 2.231 | 508.647 | |
| Grenada |  GRD GRD | 1 | 8.887 | 931.099 | |
| Hong Kong |  HKG HKG | 2 | 0.267 | 5.860 | |
| India |  IND IND | 2 | 0.001 | 0.771 | |
| Israel |  ISR ISR | 3 | 0.347 | 7.824 | |
| Ivory Coast |  CIV CIV | 1 | 0.038 | 16.26 | |
| Jordan |  JOR JOR | 1 | 0.098 | 23.469 | |
| Kosovo |  KOS KOS | 3 | 1.657 | 400.855 | |
| Mozambique |  MOZ MOZ | 1 | 0.032 | 68.695 | |
| Panama |  PAN PAN | 1 | 0.232 | 16.588 | |
| Puerto Rico |  PRI PRI | 2 | 0.699 | 21.284 | |
| Singapore |  SGP SGP | 1 | 0.171 | 2.963 | |
| Syria |  SYR SYR | 1 | 0.057 | 15.385 | |
| Tajikistan |  TJK TJK | 1 | 0.105 | 126.614 | |
| Uganda |  UGA UGA | 3 | 0.066 | 79.506 | |
| United Arab Emirates |  ARE ARE | 1 | 0.101 | 2.826 | |
| Venezuela |  VEN VEN | 2 | 0.07 | 41.144 | |
| Vietnam |  VNM VNM | 1 | 0.01 | 2.936 |
Golds per person = Number of golds ÷ population (millions)
Golds per GDP = Number of golds ÷ GDP (trillions)
Summer Olympic medal tables often look familiar – the USA, China, Great Britain, Russia and Australia usually dominate. But that doesn’t show the whole picture. These nations have larger populations and more money to spend than average.
To uncover the real Olympic champion, we worked out which countries have won the most gold medals per person and per national wealth since 1996. Click on golds per person and golds per gross domestic product (GDP) in the table above to get a better picture.
We start in Atlanta ’96 because that was the first summer Olympics without the USSR. The USSR were a huge medal winner so a time span both with and without them gives inconsistent data.
Jamaica are top dogs
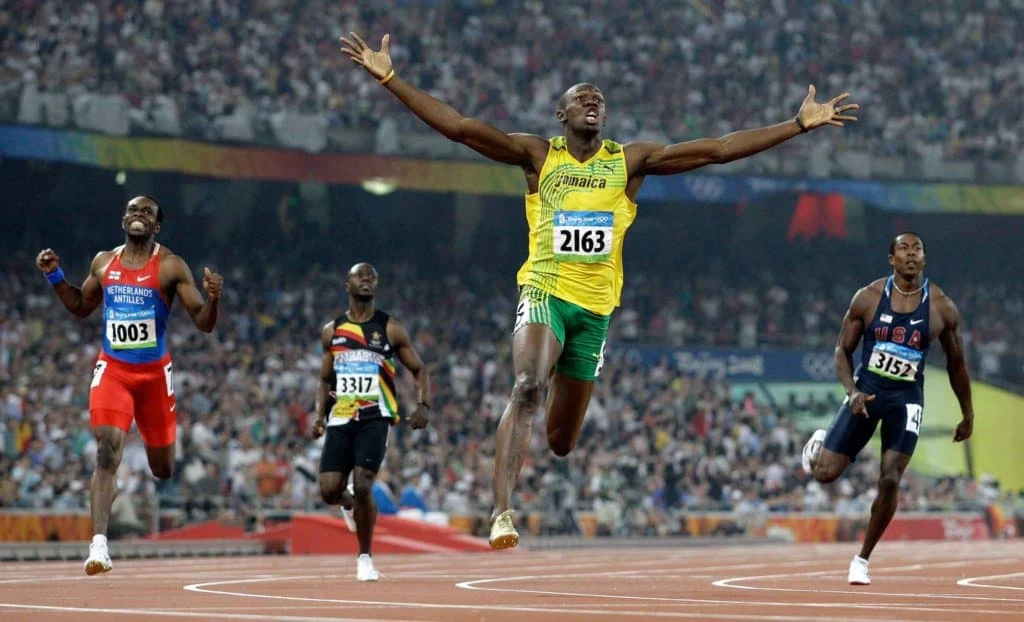 The standout nation from our research is Jamaica. They rank number 1 for gold per GDP, with 1,546.247 golds achieved for each $1 trillion of GDP. For comparison the USA scores 13.6!Jamaica’s 7.43 gold per million people stat is also impressive, with only 2 nations able to beat it. For comparison, China scores 0.157.This is in no small part down to their sprinting ability. Every gold medal won by the Jamaican Olympic team since 1996 has been on the track (100m, 110m hurdles, 200m and 400m). What makes this even more impressive is that Jamaica only really came to the party in 2004. In Atlanta 1996 and Sydney 2000 they won just 1 gold medal. So hats off to the sprinters, who have pushed their nation to dizzy Olympic heights!
 Cuba gets second place
Cuba ranks an impressive 6th for both gold per person and gold per GDP. The reason for this is combat sports. 22 of their 49 gold medals since 1996 have come in boxing, with each Olympics providing a minimum of 2 boxing golds. 13 gold medals have come from Judo and Wrestling since 1996, meaning just over 70% of their overall triumphs have been in combat sports.
Boxing is a huge deal in Cuba. Of the 99,000 registered athletes in Cuba currently, 19,000 are boxers, with only 12 making the Olympic team.
North Korean flexing
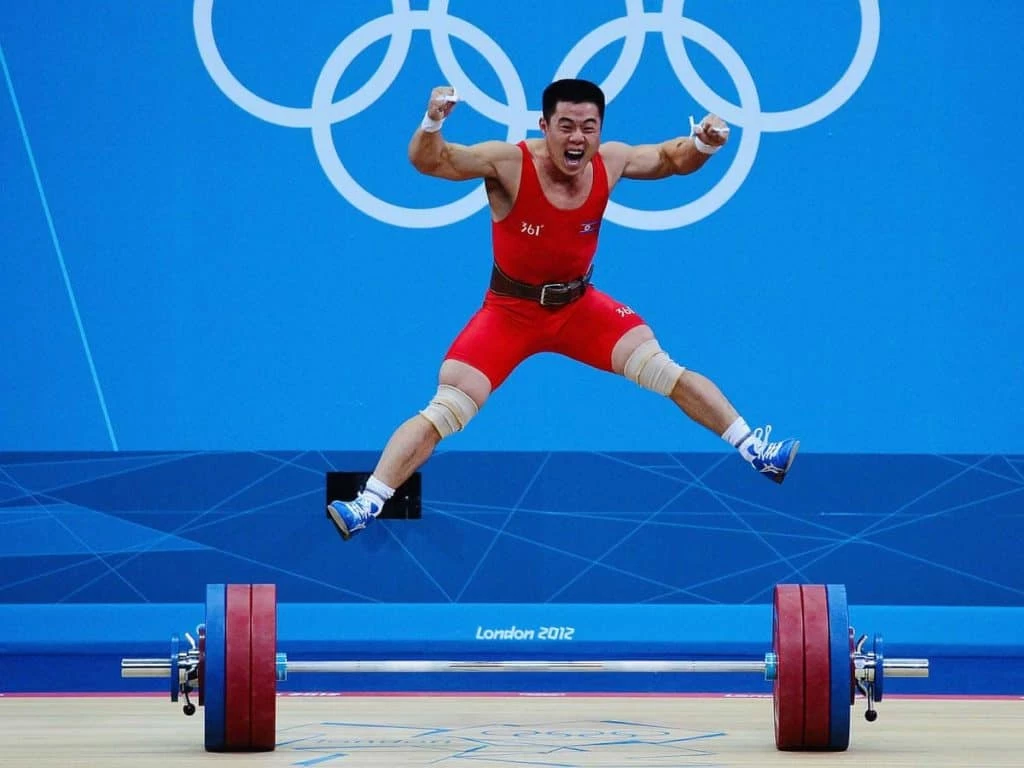 Despite only having a GDP of $18 billion North Korea managed a monumental 10 golds. That gets them 5th place in golds per GDP behind only Grenada, Jamaica, Georgia and the Bahamas. While the nation is getting great value for money here, they’re not doing so well per person, ranking 52nd.The North Koreans perform admirably in weightlifting, winning 5 golds since Atlanta ’96. 3 of their triumphs have come in gymnastics, with the other 2 in wrestling and judo. Clearly, they are excelling in strength-based events and reaping the rewards.The recipe for their success is unknown. When their weightlifters were quizzed about their training methods back in 2014 they responded in cryptic fashion, with Om Yun Chol saying “I have a question for the journalists here, have you ever heard that an egg can break a stone?”. I have not heard that but I have heard of steroids.
 Former Soviet strength
 The USSR was an Olympic force to be reckoned with before its dissolution. However, their legacy remains alive within the former states. Since 1996, these 15 countries have won 274 gold medals combined, being most successful in wrestling (51 golds) followed by gymnastics (34), athletics (33), and boxing (27). Russia won 61.6% of those.Each former Soviet state performs well in gold per GDP. In fact, 10 of the 15 countries rank in the top 30. Georgia performs best, ranked 3rd for golds per GDP and 13th for golds per person. 8 former Soviet states beat Russia itself in golds per GDP and 5 do so in golds per person.
 New Zealand beats Australia
 For gold medals per person, New Zealand ranks 4th and Australia ranks 9th.For gold per GDP New Zealand ranks 23rd, the highest of any major first-world country. Meanwhile, Australia achieves almost half as many golds per GDP ranking 40th.The sporting prowess of the 2 nations comes from the water. An amazing 68.1% of their combined gold medals since 1996 have come in water sports, with swimming being the most fruitful. Rowing is the next best with 16.38% of the 2 nation’s gold medal haul.
 USA and China not so mighty after all
 Anyone looking at the raw data for Olympic gold medals would assume China and The USA are performing admirably. However, our data suggests otherwise.Ranking 75th (China) and 78th (USA) in golds per GDP proves the 2 powerhouses aren’t getting the best bang for their buck. The USA then ranks 37th in gold per person while China comes a lowly 68th.
 Substandard Subcontinent
By far the worst performing region by our metrics is the Indian Subcontinent – made up of;
India
 Pakistan
 Bangladesh
 Sri Lanka
 Nepal
Nepal
 Bhutan
 The Maldives
Between these 7 countries, only 2 gold medals were mustered since 1996. Both of these were won by India – Abhinav Bindra in shooting at Beijing 2008 and Neeraj Chopra in the javelin at Tokyo 2020.
On this day, the 11th August at 2008 Beijing Olympics, Abhinav Bindra won India’s first-ever and the only individual Olympic Gold Medal! We are extremely proud of this historic achievement by @Abhinav_Bindra 🥇 pic.twitter.com/N6DpLBH1DD
— Kiren Rijiju (@KirenRijiju) August 11, 2020
Combined, the 7 nations have a population of 1.8 billion people so a haul of 2 gold medals seems pretty pitiful. As developing nations, you would assume their athletes are not getting the funding needed, but that is why we measure golds per GDP, at which they do just as poorly.
As the Head of the Indian Olympic Association mentions below, families traditionally favor giving their children a good education over focusing on sports, with the possible exception of cricket. India and Pakistan can match anyone on the global cricketing stage. This suggests these countries could do better in the Olympics if the desire was there.
Sport has always taken a back seat vis a vis education
Narayana Ramachandran, Head of the Indian Olympic Association

Nakul Shah
Author


In 2016, I worked on my first client to help write a white paper for a crypto and blockchain project they were building, and started delving deeper into blockchain and distributed ledger technology.
More by Nakul Shah