| Rank | Country name | Country | Gold | Golds per Person | Golds per GDP |
|---|---|---|---|---|---|
| 1 | United States |  USA USA | 39 | 0.118 | 2.002 |
| 2 | China |  CHN CHN | 38 | 0.026 | 3.105 |
| 3 | Japan* |  JPN* JPN* | 27 | 0.213 | 5.542 |
| 4 | Great Britain |  GBR GBR | 22 | 0.324 | 8.34 |
| 5 | Russia/ROC |  ROC ROC | 20 | 0.137 | 12.674 |
| 6 | Australia |  AUS AUS | 17 | 0.667 | 12.85 |
| 7 | Netherlands |  NLD NLD | 10 | 0.584 | 12.034 |
| 8 | Italy |  ITA ITA | 10 | 0.165 | 5.144 |
| 9 | France |  FRA FRA | 10 | 0.153 | 3.871 |
| 10 | Germany |  DEU DEU | 10 | 0.119 | 2.708 |
| 11 | New Zealand |  NZL NZL | 7 | 1.452 | 34.314 |
| 12 | Cuba |  CUB CUB | 7 | 0.618 | 72.917 |
| 13 | Canada |  CAN CAN | 7 | 0.185 | 4.25 |
| 14 | Brazil |  BRA BRA | 7 | 0.033 | 3.408 |
| 15 | Hungary |  HUN HUN | 6 | 0.621 | 42.857 |
| 16 | South Korea |  KOR KOR | 6 | 0.117 | 3.919 |
| 17 | Jamaica |  JAM JAM | 4 | 1.351 | 285.714 |
| 18 | Norway |  NOR NOR | 4 | 0.738 | 10.025 |
| 19 | Czech Republic |  CZE CZE | 4 | 0.374 | 18.519 |
| 20 | Poland |  POL POL | 4 | 0.106 | 7.605 |
| 21 | Kenya |  KEN KEN | 4 | 0.074 | 4.082 |
| 22 | Slovenia |  SVN SVN | 3 | 1.443 | 61.224 |
| 23 | Croatia |  HRV HRV | 3 | 0.731 | 54.545 |
| 24 | Denmark |  DNK DNK | 3 | 0.518 | 9.091 |
| 25 | Bulgaria |  BGR BGR | 3 | 0.432 | 51.724 |
| 26 | Switzerland |  CHE CHE | 3 | 0.347 | 4.418 |
| 27 | Serbia |  SRB SRB | 3 | 0.343 | 73.171 |
| 28 | Sweden |  SWE SWE | 3 | 0.297 | 5.597 |
| 29 | Belgium |  BEL BEL | 3 | 0.259 | 6.061 |
| 30 | Uzbekistan |  UZB UZB | 3 | 0.09 | 60 |
| 31 | Spain |  ESP ESP | 3 | 0.064 | 2.283 |
| 32 | Iran |  IRN IRN | 3 | 0.036 | 6.608 |
| 33 | Bahamas |  BHS BHS | 2 | 5.086 | 166.667 |
| 34 | Kosovo |  KOS KOS | 2 | 1.033 | 86.957 |
| 35 | Qatar |  QAT QAT | 2 | 0.694 | 11.976 |
| 36 | Georgia |  GEO GEO | 2 | 0.501 | 133.333 |
| 37 | Ireland |  IRL IRL | 2 | 0.405 | 6.042 |
| 38 | Israel |  ISR ISR | 2 | 0.231 | 5.666 |
| 39 | Greece |  GRC GRC | 2 | 0.192 | 9.852 |
| 40 | Ecuador |  ECU ECU | 2 | 0.113 | 19.231 |
| 41 | Chinese Taipei/Taiwan |  TWN TWN | 2 | 0.084 | 2.994 |
| 42 | Uganda |  UGA UGA | 2 | 0.044 | 76.923 |
| 43 | Turkey |  TUR TUR | 2 | 0.024 | 2.347 |
| 44 | Bermuda |  BMU BMU | 1 | 16.057 | 142.857 |
| 45 | Fiji |  FJI FJI | 1 | 1.116 | 200 |
| 46 | Estonia |  EST EST | 1 | 0.754 | 37.037 |
| 47 | Latvia |  LVA LVA | 1 | 0.53 | 33.333 |
| 48 | Puerto Rico |  PRI PRI | 1 | 0.35 | 100 |
| 49 | Slovakia |  SVK SVK | 1 | 0.183 | 10.417 |
| 50 | Hong Kong |  HKG HKG | 1 | 0.133 | 2.933 |
| 51 | Austria |  AUT AUT | 1 | 0.111 | 2.398 |
| 52 | Belarus |  BLR BLR | 1 | 0.106 | 18.519 |
| 53 | Portugal |  PRT PRT | 1 | 0.098 | 4.566 |
| 54 | Tunisia |  TUN TUN | 1 | 0.085 | 25 |
| 55 | Romania |  ROU ROU | 1 | 0.052 | 4.717 |
| 56 | Venezuela |  VEN VEN | 1 | 0.035 | 10.204 |
| 57 | Morocco |  MAR MAR | 1 | 0.027 | 9.091 |
| 58 | Ukraine |  UKR UKR | 1 | 0.023 | 8.929 |
| 59 | South Africa |  ZAF ZAF | 1 | 0.017 | 2.865 |
| 60 | Thailand |  THA THA | 1 | 0.014 | 2.198 |
| 61 | Egypt |  EGY EGY | 1 | 0.01 | 4.255 |
| 62 | Philippines |  PHL PHL | 1 | 0.009 | 3.185 |
| 63 | Ethiopia |  ETH ETH | 1 | 0.009 | 12.346 |
| 64 | Indonesia |  IDN IDN | 1 | 0.004 | 0.985 |
| 65 | India |  IND IND | 1 | 0.001 | 0.377 |
Golds per person = Number of golds ÷ population (millions)
Golds per GDP = Number of golds ÷ GDP (trillions)
The top of the Tokyo 2020 medal table is a replica of previous Olympics with the same countries featuring yet again; USA, China, Japan, Russia and Great Britain. These nations have obvious advantages over their opponents thanks to larger populations, higher GDPs or both.
To discover the real 2020 Olympic champion, we worked out which countries have won the most gold medals per person and per national wealth. Click on golds per person and golds per gross domestic product (GDP) on the table above to get a better picture.
We’ve also applied this metrics to all the Summer Olympics (since 1996) and all the Winter Olympics (since 1994).
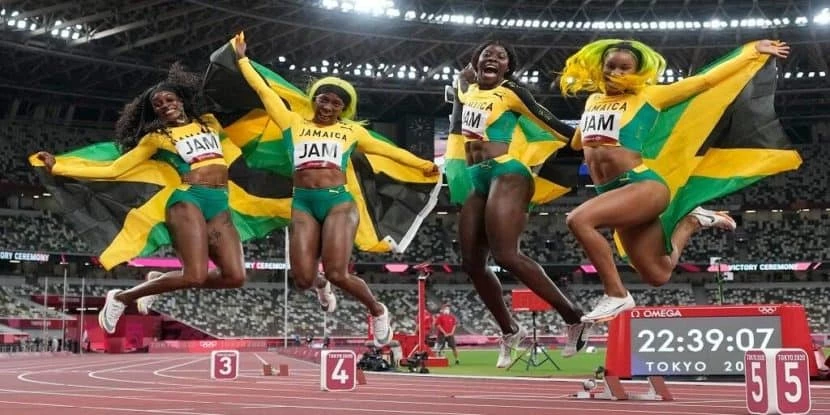
Jamaica rule the roost!

It was another successful games for the Caribbean islanders based on our metrics. 4 Gold medals mean they’re top of the golds per GDP table and rank 5th in the golds per person charts. Once again, all 4 of their triumphs came on the track. This is no surprise as every Olympic gold medal won in Jamaica’s history has come through Athletics. Elaine Thompson Herah was the star, winning 2 individual golds and running 1 leg of their relay win.
Jamaica have really established themselves as the best performing Olympic nation since 1996 and once again have showed the world how it’s done in Tokyo.
Brilliant Bahamas

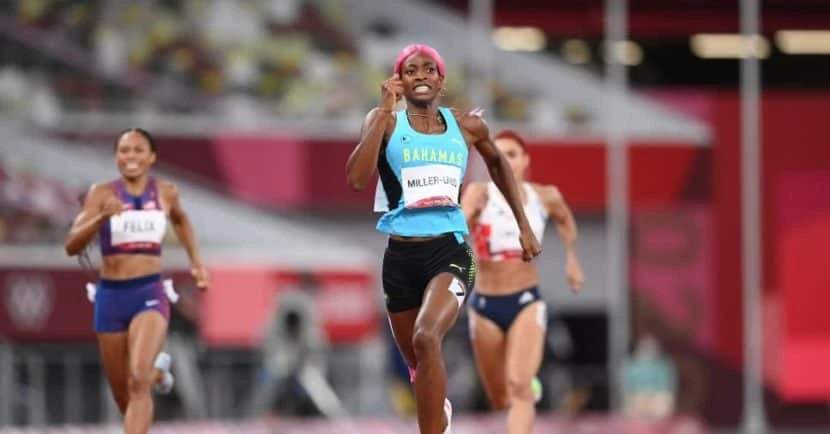
Another nation who’s success can be found on the track is the Bahamas. Their haul of 2 golds is their joint best in history (level with Sydney 2000). From the 13 track athletes sent, 2 returned home with the top prize (Steven Gardiner and Shaunae Miller-Uibo – both in the 400m).
As a result, they rank at the sharp end of our metrics. 2nd best in golds per population and 3rd best in golds per GDP. The small Caribbean island is getting great value for money and squeezing the most out of its small population.
1 Gold is enough for Fiji & Bermuda

Despite winning a solitary gold medal, both Fiji and Bermuda performed extremely well at Tokyo 2020.
Fiji have been massively boosted by the inclusion of Rugby 7s from Rio 2016 and beyond. Before that, the Pacific Islanders had not won a single medal at the Olympics, but gold at both Rio 2016 and Tokyo 2020 in the men’s event has finally given them success. The women also managed a bronze, meaning Tokyo 2020 is their greatest Olympic medal haul in history.
Tokyo 2020 brought Bermuda’s first ever gold medal and their first medal of any color since a Boxing bronze in 1976. This is even more impressive since they only sent 2 athletes to Tokyo. Flora Duffy created this piece of history in the Triathlon and propelled Bermuda right to the peak of our adjusted medal tables. 16 Gold medals per million people is an incredible number, over 3 times better than any other competitor. 142 Golds per GDP ranked Bermuda 4th overall, behind only Jamaica, Fiji and the Bahamas.
Kosovo fight their way to success

Kosovo participated in just their 2nd Summer Olympic games, winning 2 golds – double their 2016 tally. Judo is clearly a specialist event for the Eastern European nation with all their golds coming in this event. It results in them ranking 7th in both the golds per GDP (87) and golds per person (1.033) and putting in a very successful campaign. 5 of the 11 athletes sent to Tokyo competed in Judo, with Swimming (2) the only other event to have more than 1 Kosovan.
New Zealand outperform Australia again

7 Golds is New Zealand’s greatest Olympic campaign since 1984 and means they are outperforming their Australian neighbors when you consider resources. The Kiwis tend to do well on the water, and proved that once again with 3 Rowing golds and 3 Canoeing golds – the other gold coming in women’s Rugby 7s. New Zealand are 3rd best in golds per person and 16th best in golds per GDP.
Australia equalled their best medal total (Athens 2004) which places them in a respectable 12th in golds per person and 22nd in golds per GDP. Much like their neighbors, they dominated on the water – 15 of their 17 golds came in Swimming (9), Rowing (2), Canoeing (2) and Sailing (2). Their only other successes came in Skateboarding (1) and Cycling (1). This wasn’t enough to defeat the Kiwis in our metrics though, who keep hold of local bragging rights.
USA disappoint

After having Covid-19 issues, the USA didn’t perform at their best at Tokyo 2020. They topped the gold medal charts with 39, but that doesn’t tell the whole story. The USA rank a lowly 38th in gold medals per person and 63rd for golds per GDP, ahead of only Indonesia and India. Whilst it’s impressive topping the medal chart, this shows the USA could be getting a lot more from their population and are far from maximising their medal hauls.

Eugene Abungana
Author
I have worked with several companies in the past including Economy Watch, and Milkroad. Writing for BitEdge is highly satisfying as I get an opportunity to share my knowledge with a broad community of gamblers.
More by Eugene Abungana


