Exporting the data from BitOdds
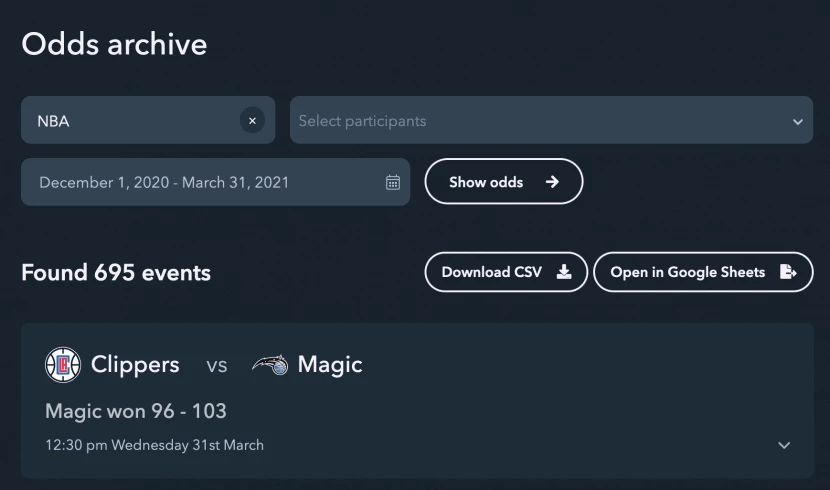
For this example, we will export NBA data for the 2020-21 season. To export the data:
- Open the BitOdds archive.
- Select NBA in the competition dropdown.
- Specify a date range and click Apply.
- Click Download CSV.
Since the 2020-21 NBA season ran from December 2020 to July 2021, we need to make sure the date range covers this period. The archive only allows exporting 1,000 events at a time so we need to perform two exports and then combine the data in Pandas. The date ranges for the exports are:
- December 1, 2020 to March 31, 2021
- April 1, 2021 to July 31, 2021
After downloading the CSV files for this two date ranges you will have two files in your Downloads folder:
-
bitodds_export_NBA_2020-12-01_2021-03-31.csv -
bitodds_export_NBA_2021-04-01_2021-07-31.csv
Running the code in your browser
To make it easy to execute the code in this article, we have created a git repository containing the CSV files and a Jupyter notebook that you can use to run the analysis and explore the data for yourself. The easiest way to run the notebook is to launch it in Binder with the following link (note it may take a minute to launch):
Running the code on your computer
Installing Python
If you are on Windows you can download the Python installer.
If you are on macOS or Linux you may already have Python 3 installed. You can find out by running
python3
in the terminal. If you don’t have Python 3 installed, you can install it with your system package manager. If you are on macOS we recommend using Homebrew.
Installing the dependencies and launching JupyterLab
After downloading and extracting the zip, open a terminal and then run the following commands to create a Python virtual environment, install the requirements and start JupyterLab:
cd Downloads/bitodds-data-analysis-master
python3 -m venv .venv
.venv/bin/pip install -r requirements.txt
.venv/bin/jupyter lab
You will then be able to go to
http://localhost:8888/
in your browser to access JupyterLab. If you need to restart JupyterLab (eg after rebooting your computer) you can do so by running the following commands in your terminal:
cd Downloads/bitodds-data-analysis-master
.venv/bin/jupyter lab
Navigating inside JupyterLab
Once you have opened JupyterLab you will see the following:
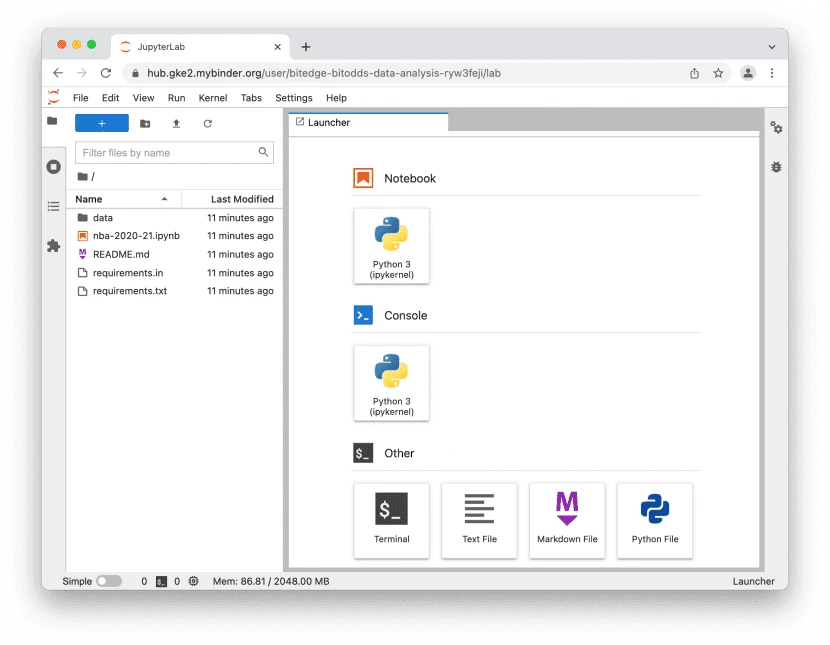
Click on the file named
nba-2020-21.ipynb
on the left and it will open the notebook:
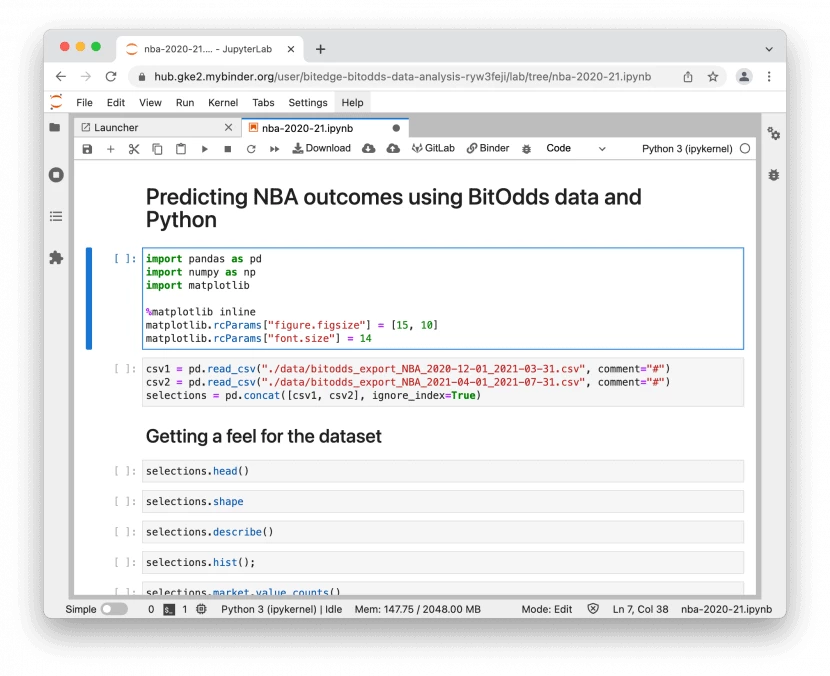
The notebook is divided into cells which each contain code. To execute the code in a cell, click inside the cell and then type
Shift+Enter
. The output produced by the code in the cell will appear below the cell and the next cell will be selected. You can continue to type
Shift+Enter
to execute each cell in the notebook one by one and inspect the results. You can edit the code in any cell and re-run it and cells don’t strictly need to be run from top to bottom, however, you may encounter errors if you run cells out of order.
If you would like to run the entire notebook rather than stepping through each cell one by one, select the Run All Cells option from the Run menu.
Exploring the dataset
The first thing we do in the notebook is to import the Python packages we need and configure the
matplotlib
package to make the plots that we will generate more readable:

Next, we use the Pandas package to load the CSV files with the
pd.read_csv()
function. This function will return a
DataFrame
which is an object for representing and interacting with tabular data. Since our data is split across two CSV files we need to call
read_csv
twice and combine the two DataFrames into one using pd.concat():

We can now take a look at the data using
selections.head()
which will show the first 5 rows:
| home | away | date_utc | result | market | selection | market_qualifier | is_winner | sportsbet_odds | cloudbet_odds | stake_odds | nitrogen_odds | betbtc_odds | betcoin_odds | average | trustdice_odds | |
|---|---|---|---|---|---|---|---|---|---|---|---|---|---|---|---|---|
| 0 | Suns | Hawks | 2021-03-31 02:00:00 | Suns won 117 – 110 | event_winner | Suns | NaN | yes | 1.44 | 1.44 | 1.44 | 1.43 | 1.436 | 1.44 | 1.438 | NaN |
| 1 | Suns | Hawks | 2021-03-31 02:00:00 | Suns won 117 – 110 | event_winner | Hawks | NaN | no | 2.90 | 2.99 | 2.90 | 2.94 | 2.972 | 2.90 | 2.934 | NaN |
| 2 | Suns | Hawks | 2021-03-31 02:00:00 | Suns won 117 – 110 | spread | Suns | -5.5 | yes | 1.90 | 1.94 | 1.90 | 1.92 | 1.929 | 1.90 | 1.915 | NaN |
| 3 | Suns | Hawks | 2021-03-31 02:00:00 | Suns won 117 – 110 | spread | Hawks | 5.5 | no | 1.95 | 1.96 | 1.95 | 1.94 | 1.947 | 1.95 | 1.950 | NaN |
| 4 | Suns | Hawks | 2021-03-31 02:00:00 | Suns won 117 – 110 | total | Under | 222.5 | no | 1.85 | 1.91 | 1.85 | 1.91 | 1.903 | 1.85 | 1.879 | NaN |
We can make some observations about the dataset from this sample of rows:
- There is a row for each bet that can be made. For example, there is one row for betting on Suns to win in Suns vs Hawks and one row for betting on Hawks to win.
- The market type is indicated in the
marketcolumn and takes on the valuesevent_winner,spreadandtotal. - For spread and total markets, the
market_qualifiercolumn indicates the spread value or total value associated with the selection. For example, in the row with index 2 themarket_qualifierindicates the row is for Suns -5.5 points. - We have the market odds for 6 sportsbooks in the columns labelled
sportsbet_odds,cloudbet_oddsetc and the average of the sportsbooks’ odds in theaveragecolumn. - We have an indication of whether the selection was a winning bet or not in the
is_winnercolumn and the final score in theresultcolumn.
We use
selections.shape
to reveal the DataFrame has a total of 7,070 rows and 17 columns and we generate some statistics on the numerical columns using
selections.describe()
:

From this output we observe:
- There are roughly 7,000 odds for most sportsbooks but only 210 for Trust Dice. The missing odds appear in the DataFrame as
NaN. - The odds range from 1.03 to 17.33 and the average is around 2.1.
We can also visualize this data by plotting histograms of each column with
selections.hist()
:
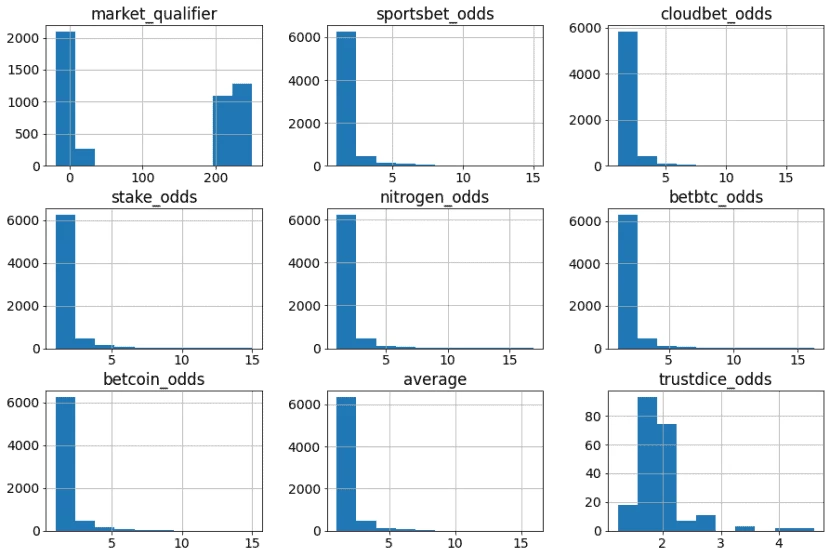
Again we see that the odds range between 1 and 17 but we now see that almost all odds are below 5.
To get an idea of the values taken by the columns containing text, we can use the
value_counts()
method on the column. For example, to see the range of values in the
market
column we call
selections.market.value_counts()
:

This indicates that there are 2,370 rows with
market
set to
total
, 2,358 with
spread
and 2,342 with
event_winner
.
Biggest upsets of the season
Suppose we want the biggest underdog wins. We first massage the data a little bit:

The code above:
- Drops all the rows except where
marketis equal to'event_winner'. - Changes the values in the
is_winnercolumn from text strings of"yes"and"no"to boolean values ofTrueandFalse. - Adds a new column
sidewhich will be"home"or"away". - Adds a new column
best_oddswhich will be the highest odds offered by any sportsbook. - Renames the columns
averageanddate_utccolumns toaverage_oddsanddate. - Drops all the columns except for
home,away,date,result,selection,side,average_odds,best_oddsandis_winner.
The DataFrame now looks like:
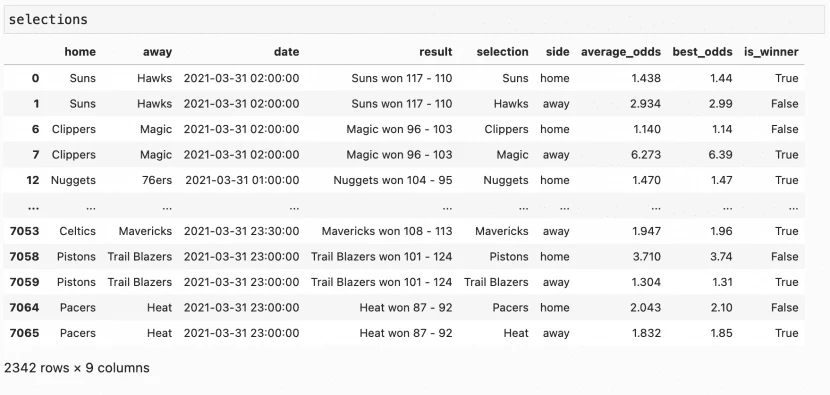
Finding the biggest upsets can now be achieved by:
- Filtering the DataFrame to only contain rows where
is_winnerisTrue. - Sorting the resulting DataFrame by odds in descending order.
- Keeping only the top 5 selections.
Pandas make it easy to do all this in one line of code:

So the biggest upset of the season was the Houston Rockets beating the Milwaukee Bucks where the Rockets had average odds of 8.46. Interestingly the top three upsets were all against the Bucks!
Is the home team advantage accurately reflected in the odds?
To find out if there was a home team advantage in the NBA 2020-21 season we can compare the rate at which home teams win with the rate at which away teams win. To calculate the win rates we can use a neat trick: when you tell Pandas to calculate the average of a column of booleans using the
mean()
function it will treat
False
as
0
and
True
as
1
. So if we take the mean of the
is_winner
column and it contained 8
True
values and 2
False
values we would get 0.8 or 80% which is exactly the win rate.
Now we want to calculate the win rate separately for the rows where
side = "home"
and where
side = "away"
. We can achieve this by telling Pandas to
groupby("side")
before calculating the mean on
is_winner
:

This reveals that away teams won only 45.3% of games whereas home teams won 54.7% of games. This is a whopping 9.4% difference! Let’s see whether this difference is priced into the odds…

The average odds for home teams is indeed shorter than for away teams but this doesn’t reveal whether the sportsbooks have adjusted the odds by the correct proportion given the magnitude of the home side advantage. To determine this we convert the odds into implied probability which is the probability a bet would have if the odds were fair (ie if the sportsbook edge was zero). We calculate implied probability as
1/odds
:
![]()
Now we calculate the average implied probability for home versus away bets:

We see that the difference in average implied probability values are in line with the win rates we calculated. The implied probabilities are a few percentage points higher because of the sportsbook edge. Unfortunately, this means we can’t use our estimate of the home-side advantage alone to beat the sportsbooks.
Do teams perform better after a win?
Another interesting question to ask is whether teams perform better coming off a win vs coming off a loss. To investigate this we first need to add an extra column to our DataFrame indicating whether the team had won their previous game. We can achieve this with the following code:
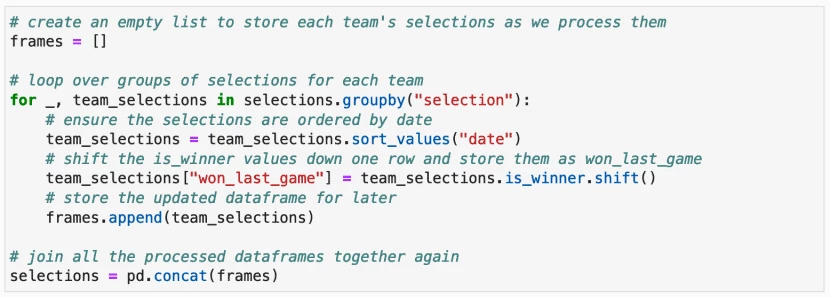
Here process the selections for each team individually, using the
shift()
method to translate the
is_winner
values down one row, storing them in a new column called
won_last_game
. Once we have performed this update on separate DataFrames for each team we recombine the DataFrames using
pd.concat()
. The result is:
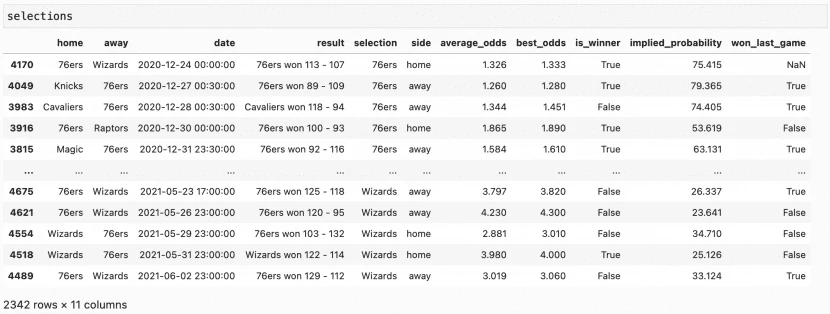
We see that the
won_last_game
value always matches the previous row’s
is_winner
value except for the team’s first game of the season where
won_last_game
is
NaN
. We can’t use these rows where
won_last_game
is
NaN
so we drop them with:
![]()
A naive look at the impact of coming off a win or a loss would be to calculate the win rate based on whether or not the team won their last game:

This indeed shows that teams coming off a win do win their next game more often (54%) than teams coming off a loss (46%). However, this might not be causal as there is a confounding factor we need to consider: good teams will more often be coming off a win and will win their next game because they are good, whereas bad teams will more often be coming off a loss and lose their next game because they are bad.
To compensate for this we can examine the performance of favourites vs underdogs based on their previous results. We first add a new column indicating whether a team is an underdog based on whether their odds are over 2:

We again calculate the win rate but this time based on
won_last_game
and
is_underdog
:

In this table, the top-left cell is the win rate for favourites that didn’t win their last game (
is_underdog = False
,
won_last_game = False
), the top-right cell is the win rate for underdogs that didn’t win their last game (
is_underdog = True
,
won_last_game = False
) etc.
We see that when a team is the favourite, having won their last game only increases their chance of winning by 2% (from 64% to 66%). However, for underdogs, the effect is much larger. An underdog coming off a win is 5% more likely to win than an underdog coming off a loss (from 30% to 35%).
Has this difference been priced into the odds?

This table shows the average implied probability for the different combinations of
is_underdog
and
won_last_game
. If the impact of winning the last game was priced into the odds, these values would be the same as the win rate plus a few percentage points due to the sportsbook edge. We see that the sportsbooks’ implied probability is around 2% higher than the win rate in all cases except for underdogs coming off a win, where it is only 0.7%. This could indicate the sportsbooks underestimated the increase in underdogs’ chances when coming off a win.
Predicting winners and finding profitable bets
Now that we have identified some variables that can be used to predict which team will win, we are ready to build our prediction model. There are many excellent machine learning and statistics frameworks for Python, including:
- scikit-learn
- statsmodels
- TensorFlow
- PyTorch
We will use scikit-learn as it is both easy to use and very powerful. The first step is to decide on a model class. Scikit-learn has a large number of these such as ordinary least squares, nearest neighbours, random forests and neural networks. Finding the best model type to use is a bit of trial and error, although scikit-learn does have tools to help with model selection. We found that the support vector machine model is well suited to our task so we start by importing the
SVM
class:

Scikit-learn can only handle numeric data so we cannot use our
side
the column which contains the text values
"home"
and
"away"
. Instead, we create a boolean column named
is_home
. Next, we need to split our data into a training subset and an evaluation subset. We pretend that we decided to train our model exactly halfway through the season and then use the model for betting for the remaining half of the season. We, therefore, need to sort the selections by date and then split the DataFrame into two halves using the
np.split()
function. Finally, we assign the values we want to use as inputs to the model to the variables
X_train
and
X_test
and the
is_winner
values we want to predict to
y_train
and
y_test
.

Now we are ready to train our model. This is as simple as calling the
fit()
method on the model. Once the model is trained we can call
predict()
on it with the validation data to check it’s accuracy.

So our model correctly predicts the winner 69.9% of the time. This seems pretty good, but is it enough to make a profit betting with these predictions? To find out we should first determine which selections we would bet on. We want to place a bet whenever the predicted probability multiplied by the odds is greater than 1. We can predict the probability of each selection winning by using the
predict_proba()
method on our model. Using this we find the selections recommended by our model and then calculate what the profit would have been if we had bet on these:

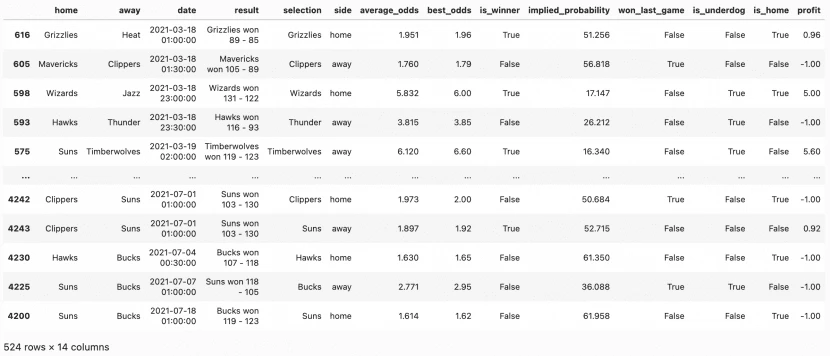
Finally, we can calculate our return on investment by adding up the
profit
column and dividing by the number of bets:

So our model would have generated a very decent 5% ROI.
Since our model only depends on three boolean inputs, we can explore what it predicts the probability of a win is and what odds we should bet on for all combinations of these inputs:
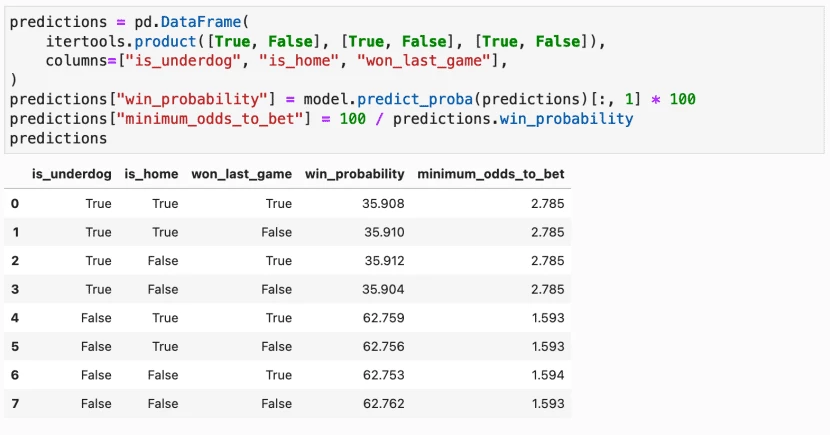
We see from this output that the model only really cares about the
is_underdog
value. It predicts underdogs have a 35.91% probability of winning regardless of whether they are the home team or whether they won their last game. Similarly, the model predicts favourites have a 62.76% chance of winning in all cases. This means we should bet on any teams that have odds between 1.593 and 1.999 or odds over 2.785. It is hard to believe this model would work in general but at least in the last half of the 2020-21 season, it would have returned a 5% profit.
Next steps
In this article, we have shown how to build a simple prediction model with BitOdds data and sci-kit-learn. Based on the 2020-21 season data it appeared to generate a very respectable 5% profit. The next step would be to test the robustness of this model. This could be done by using sci-kit-learn’s cross-validation functionality or by exporting the data from a different NBA season from BitOdds and applying the model to that.
To develop the model even further you could incorporate additional information such as the teams playing, the win rates of the teams etc. You could also try building a model that predicts the score of the game and use this to bet on the total points and spread markets.
With large amounts of sports data freely available and incredible open-source tools like Python, Jupyter, Pandas and sci-kit-learn, there has never been a better time to try your hand at data-driven sports betting. Good luck!

Eugene Abungana
Author
I have worked with several companies in the past including Economy Watch, and Milkroad. Writing for BitEdge is highly satisfying as I get an opportunity to share my knowledge with a broad community of gamblers.
More by Eugene Abungana


