


The February Rout: A Return of FTX-Level Panic
The catalyst arrived with ferocious speed last week. On February 6, 2026, Bitcoin experienced its steepest single-day drop since November 2022, plummeting to a low of $60,187 and shedding more than 12% in a matter of hours.
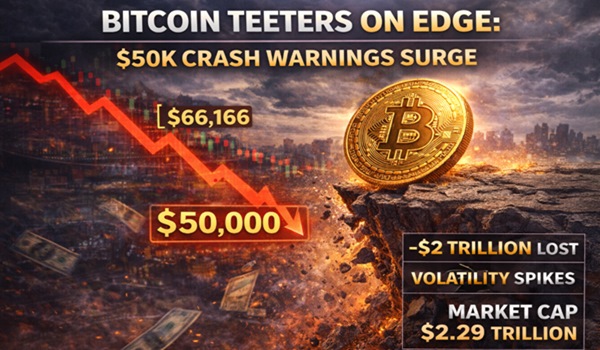
As of February 11, Bitcoin trades at $66,166, down approximately 4% on the day after opening higher and probing intraday lows near $65,934.
The asset remains pinned in a volatile band between $65,790 and $69,274, with one-week implied volatility surging to 89.61%, well above recent norms and reminiscent of the panic that gripped markets during the 2022 FTX collapse.
Liquidity Drain: ETF Reversals and Trillion-Dollar Evaporation
Total cryptocurrency market capitalization has contracted to $2.29 trillion, a 2.02% drop in the past 48 hours and part of a broader $2+ trillion evaporation since the $4.379 trillion peak in early October 2025.
Last week’s rout alone shaved 2.5% off the cap in a single session on February 9, pushing it below $2.27 trillion for the first time in 18 months.
Spot Bitcoin ETFs, previously a reliable tailwind, recorded $1.2 billion in net outflows during February, completely reversing the $50 billion of inflows accumulated throughout 2025 and signaling that even institutional participants are pulling back.
On-Chain Breakdown: Conviction and Distribution Trends
On-chain metrics reveal the depth of the conviction breakdown. Exchange inflows have jumped 15–20% over the past week, a textbook precursor to further selling pressure.
Long-term holder supply has declined from 75% of the circulating supply in late 2025 to 72%, marking the most meaningful distribution since the pre-halving accumulation phase in early 2024.
Realized daily profits have collapsed to roughly $500 million, compared with peaks of $2 billion during the rally, while the market-value-to-realized-value (MVRV) ratio sits at 1.8, still elevated enough to invite additional downside if fear intensifies.
The Halving Script: A Mutation of the Four-Year Cycle
This backdrop has reignited debate about Bitcoin’s four-year halving cycle, the supply-shock mechanism that has historically dictated its major bull and bear phases.
Every 210,000 blocks (roughly four years), miner rewards halve, reducing new issuance and, according to the classic playbook, triggering scarcity-driven rallies that peak 12–18 months later, followed by corrections of 50–80%.
After the April 2024 halving (rewards cut to 3.125 BTC per block), many participants anticipated a similar arc: a strong advance through 2025, potentially carrying Bitcoin well above $150,000 on the back of ETF adoption, then a corrective “bear leg” in 2026.
The current reality has deviated sharply from that script. Instead of a euphoric blow-off top late last year, Bitcoin reached $126,210 in October 2025 and then rolled over into a 47% drawdown without the classic signs of terminal froth.
The absence of extreme retail mania, combined with a negative annual return in 2025 despite the halving, has led some observers to question whether the cycle still holds predictive power.
Macro Risks and Technical Support Zones
Macro and technical factors are piling on additional risk. Bitcoin’s 0.8 correlation with U.S. technology stocks has amplified downside pressure amid Nasdaq turbulence. Federal Reserve uncertainties surrounding Kevin Warsh’s nomination and stalled expectations for rate cuts have contributed to risk-off flows.
Stablecoin dominance has risen to 10.3% of total crypto market cap, a defensive posture that has historically preceded bear markets lasting 6–12 months. Miner production costs remain near $77,000, raising the specter of widespread capitulation if prices cannot reclaim $70,000 soon.
On the technical front, Bitcoin balances precariously above its 200-week moving average at $58,200, a level that provided critical support in previous cycles. A decisive weekly close below that line would open the door to the $56,000 realized-price zone or the $52,000–$55,000 support cluster identified by on-chain analysts.
The immediate decision point is stark: defend $66,000 and potentially force shorts to cover, or break lower and validate the growing chorus of $50,000 forecasts.
History shows that Bitcoin has survived deeper drawdowns, including 84% in 2018 and 77% in 2022. Yet, the current combination of institutional exposure, macroeconomic uncertainty, and cycle skepticism makes the stakes feel uniquely high.
This is no ordinary dip; it is a test of whether Bitcoin can weather a storm that is challenging both its price structure and one of its most enduring narrative anchors.

 eabungana@gmail.com